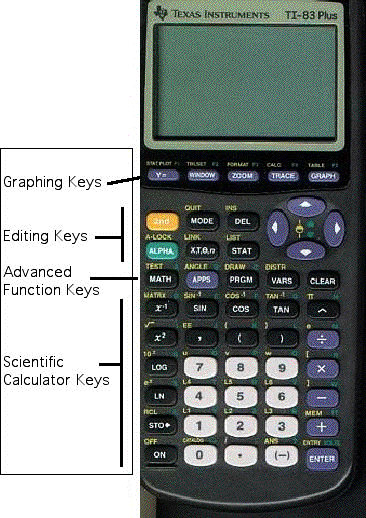
| Enter
Data: STAT - ENTER |
| Graph
Data: 2ND -
STATPLOT turn on a plotter and select the type of graph
desired. Set the graph window
using values from data then press GRAPH. |
| Graph
an equation:
Enter the equation into Y=. Set the window using WINDOW.
View the graph by pressing the GRAPH key. |
| Regression
on data: Data
must already be entered into lists. STAT - CALC select
the type of regression desired. For example: if you
select QUADREG, QUADREG will be displayed on the home
screen. Then enter the parameters: XLISTNAME, YLISTNAME,
FREQLIST, REGEQU. REGEQU is where you want the equation
stored. |
| Split
Screen: Press
MODE. Arrow down and highlight the desired type of
screen. Full is not a split screen, Horiz is a split
screen with the graph and home screen displayed, and G-T
is a split screen with the graph and table displayed |
| Change
the graphing screen: Press 2ND - FORMAT. |

